Routes and trips
 Map
Map MPR - cyclist-friendly places
 POI
POI Plan your trip
 Bike counters
 Publications
 News
News Route concept
 Contact
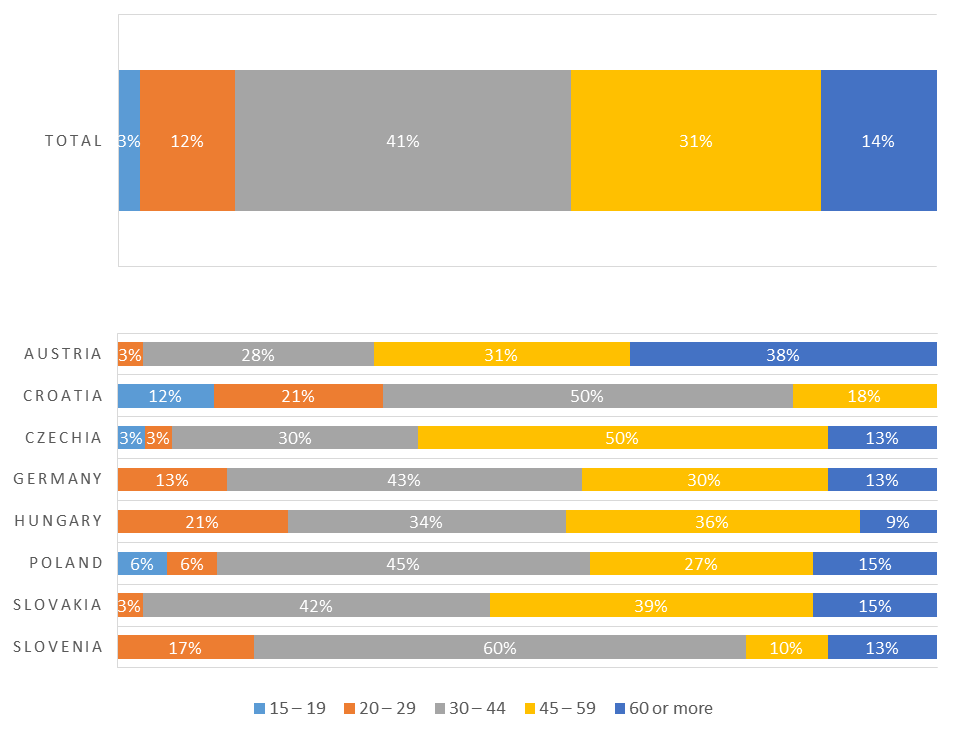
The chart below shows the age of the respondents. The higher the proportion of children and older adults, the more the route is considered pleasant and safe. In virtually every country, except Austria, the results are similar. That is, the 30–44 age group is the largest and accounts for about one-third of the surveyed cyclists; the 45–59 age group has a slightly smaller share, while those younger than 30 and older than 60 account for a few to over ten percent. In Poland, the 15–19 and 20–29 age groups accounted for 6% of responses, while those over 60 accounted for 15%. It is worth noting that, apart from Poland, surveys with respondents from the youngest age group were conducted only in the Czech Republic and Croatia. Austria is also an interesting example, where no interviews were conducted with young people, while seniors turned out to be the largest group of respondents. At the other end of the spectrum is Croatia, where we have no responses from the 60+ group.
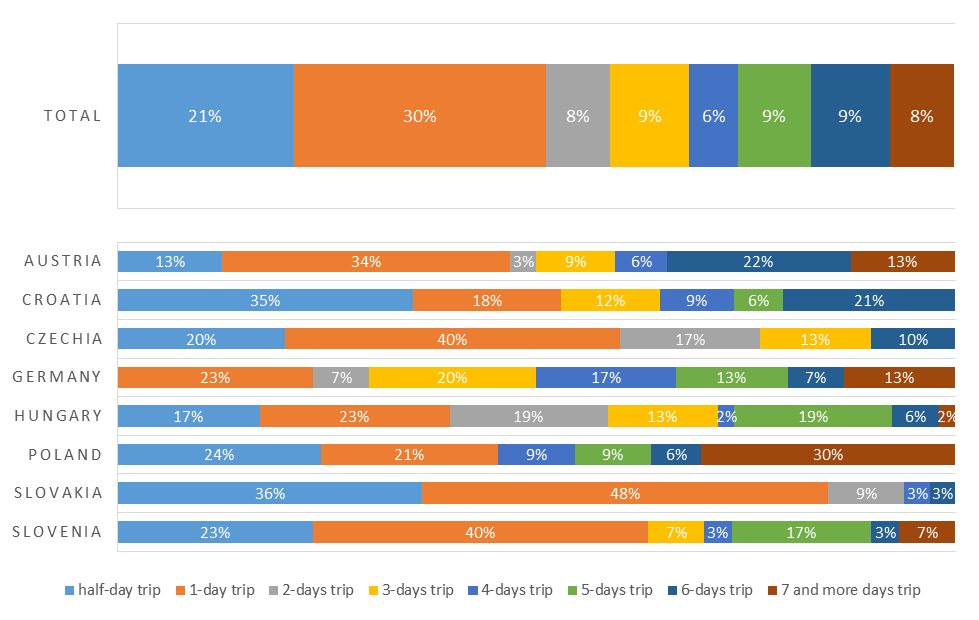
How long does a bike trip last? We see the answers to this question in the second chart. The greater the number of days on the trip, the better it speaks to the route. It is relatively easy to create an attractive section for a few hours of riding, but it is much harder to design a long, multi-day trail. Let’s remember that we’re talking about a single cycling route—EuroVelo 13—so a country’s size may influence the trip’s length, but ultimately shouldn’t. Nevertheless, even compared to Germany, Poland performs very well. Across all countries, an average of 8% of cyclists reported that their trip lasted more than a week, whereas on the Velo Baltica route, this figure was as high as 30%. Many people cover the entire distance from Świnoujście to the Tri-City or Hel. The coastal route is used for both long-distance trips and short one- or half-day excursions. Interestingly, we were unable to survey anyone who was cycling for exactly 2 or 3 days.
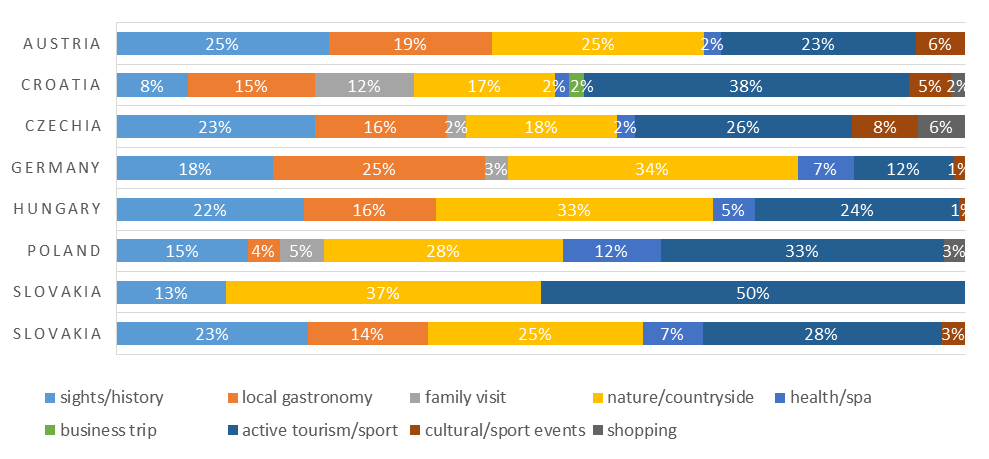
Why do cyclists take this route? Mainly to spend time actively and to connect with nature (28% each), to learn about the region’s history (20%), or to try the local cuisine (14%) —at least when we average the results across all countries. In Poland, the picture is similar, though tourists are definitely not interested in coastal delicacies; only 4% of respondents cited this as their main motivation for the trip. However, among the surveyed countries, we obtained the highest share (12%) of “health/spa” responses, which is certainly influenced by the coastal resorts.
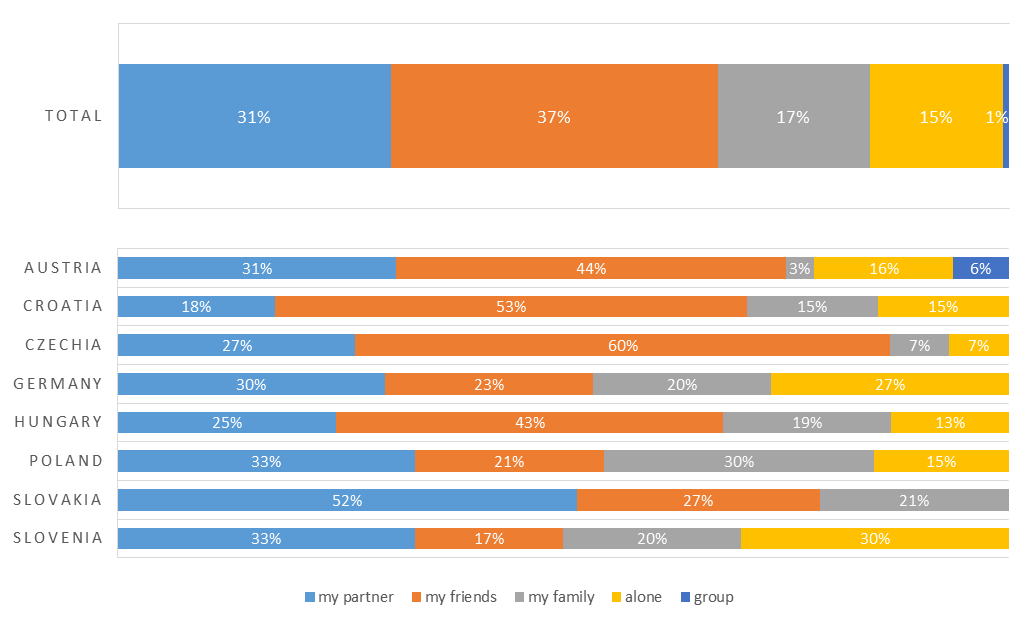
The question presented in the chart refers to the group with whom we travel. 15% of cyclists in Poland traveled alone, which is exactly the same as the average for the entire route. 21% traveled with friends, and about one-third with a partner or family. The even distribution of all responses is good news; it means that the coastal route is safe both for solo travel and as a destination for families. Poland had the highest percentage of “I’m traveling with my family” responses among all countries, which may explain the high proportion of men in the second question.
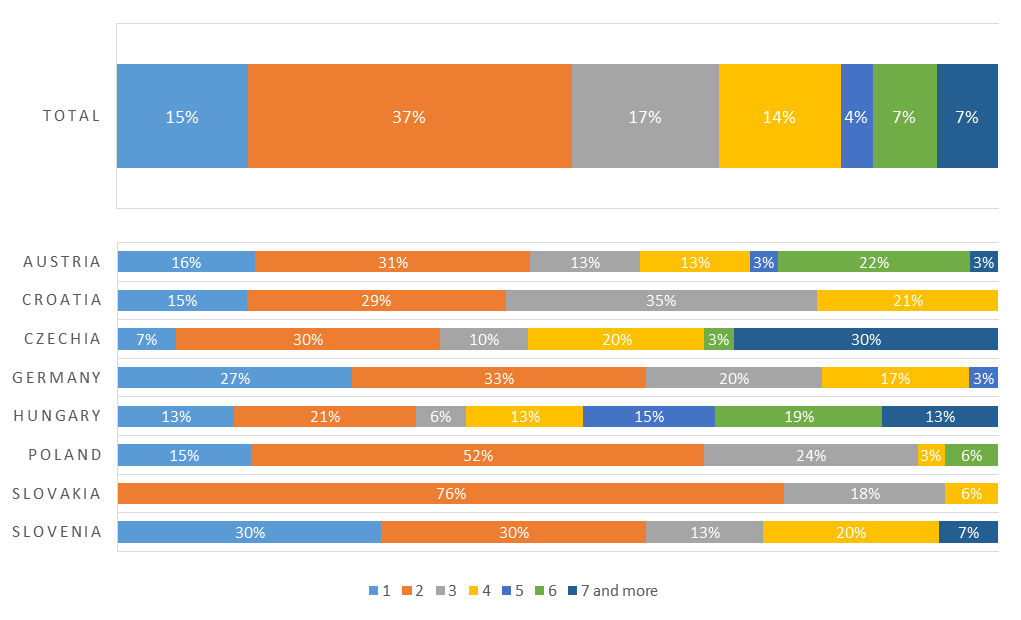
The question below concerns the size of this group. More than half of the respondents traveled in pairs; a higher proportion was recorded only in Slovakia, where no one traveled alone. The largest group we encountered along the route consisted of 6 people. In fact, everywhere except Hungary, very small groups of 2–3 people or solo travelers predominate. The Polish coast offers accommodations for larger groups, but we see that the main target of Cyclist-Friendly Places should be couples rather than organized groups.
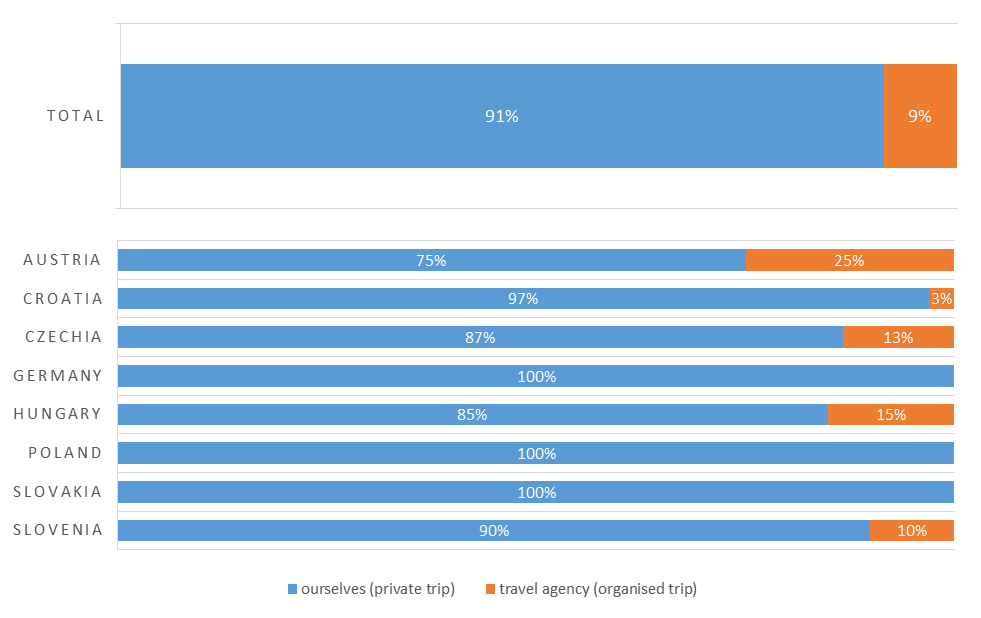
And here we can smoothly move on to the question of whether cyclists organized their trips themselves or through a travel agency. None of the respondents in Poland, nor in Germany or Slovakia, used the latter option; in the other countries, the result was negligible. This is also information for travel agencies—perhaps it’s worth starting to promote such offers?
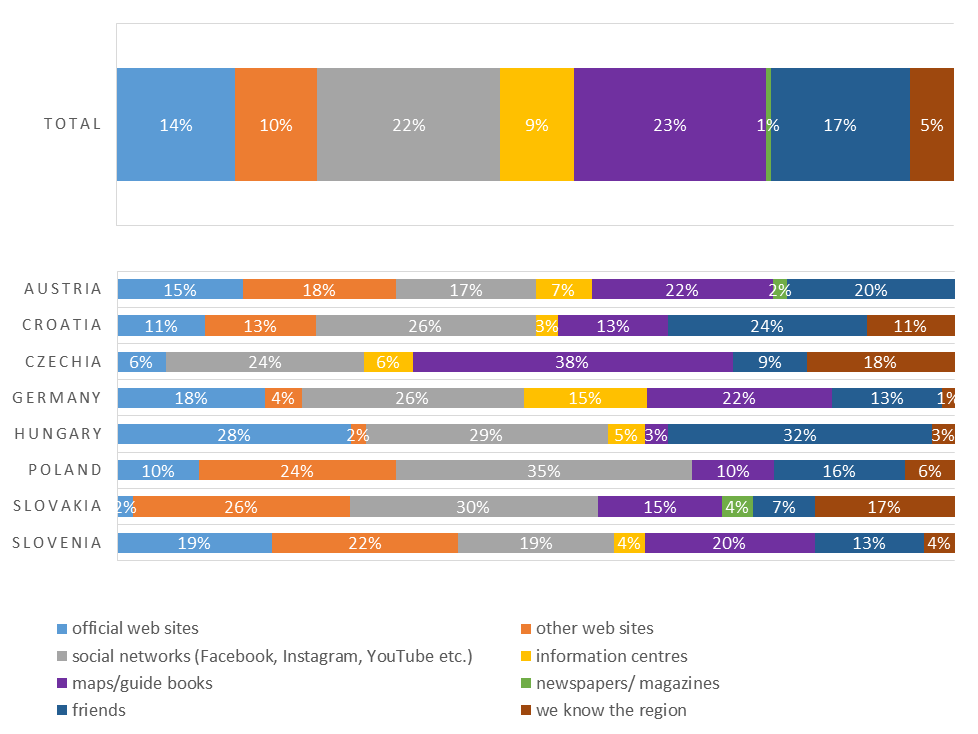
Where do people get information about their planned trip? In Poland, definitely from social media (35%), such as Facebook or Instagram. 10% of cyclists use maps and guidebooks. We remind you that paper maps are available at select tourist information centers or can be printed on your own. This is important because, despite the option to select multiple answers, no one indicated that they get information from tourist information centers, where—in addition to the aforementioned maps—local guidebooks are also available. Also, 10% of people check official websites; remember that information from sources other than our website may be out of date—we update the content on the website and in the app practically every day.
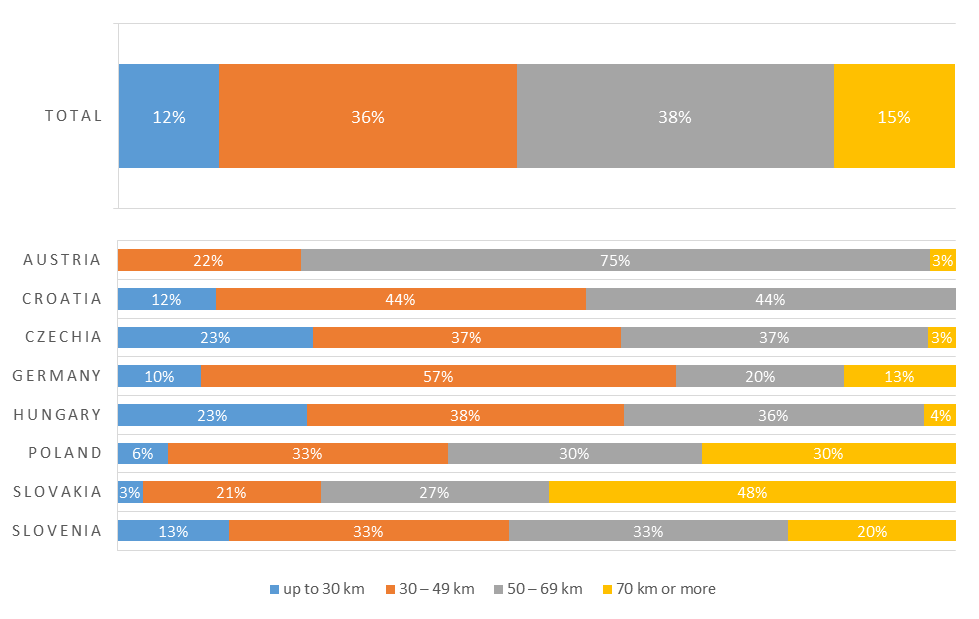
How many kilometers do you ride per day? That was the next question in the survey, and the answers were evenly split. 30% of cyclists ride 30–49 km, 50–69 km, or more than 70 km per day. This is also the second-highest percentage of “70 km and more” responses—after Slovakia; in other countries, shorter daily distances predominate. This suggests a leisurely, recreational, and tourist-oriented nature of the route.
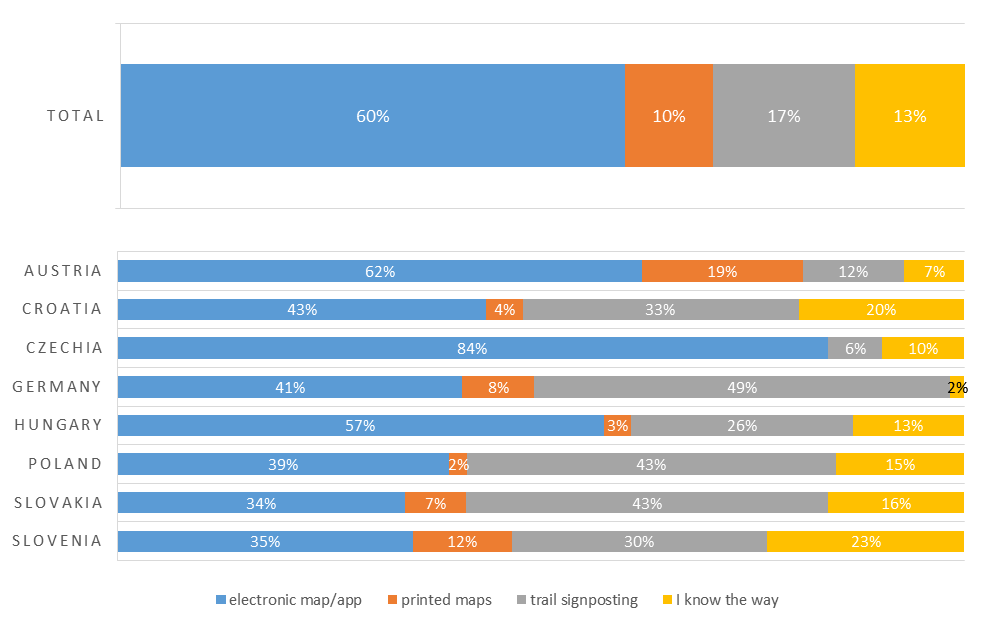
In Figure 9, we can see how tourists navigate the terrain. Interestingly, as many as 43% rely on physical, distinctive orange signs. 39% navigate using an app, and 15% know the route by heart. Only 2% of responses indicate the use of paper maps. This should come as no surprise—navigating with a phone is much simpler, though old-fashioned paper maps have their own charm.
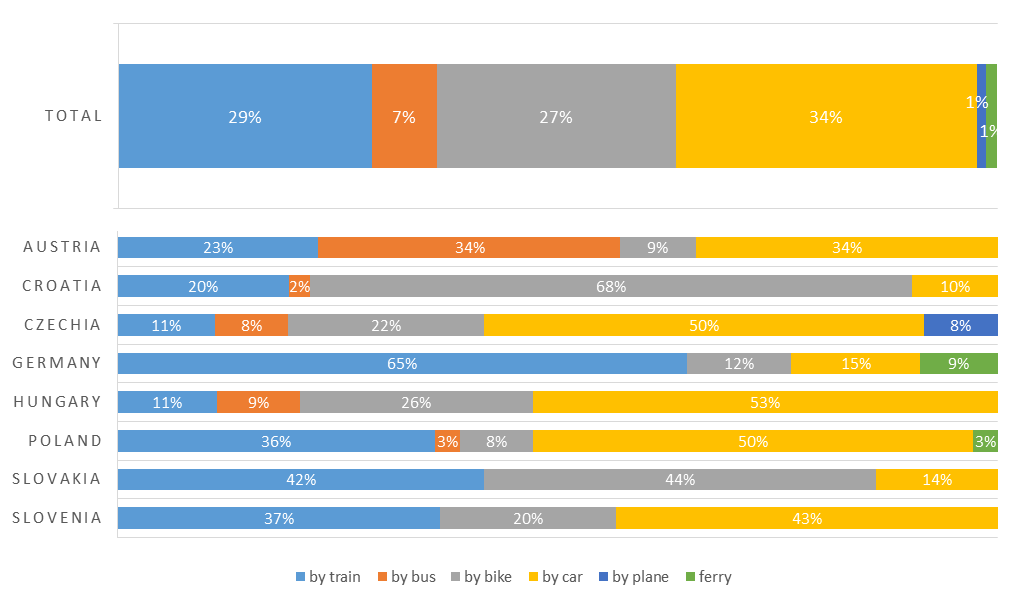
And how do you get to the start of the route? 50% of respondents in Poland chose to drive there, which is 14 percentage points higher than the average across all countries. 36% arrived by train, 8% set off by bike from their place of residence, and 3% of participants traveled by bus and—interestingly—by ferry. Hundreds of thousands of people travel the Velo Baltica route every year, and most trips take place during the summer. This means that transportation options, such as rail, must be adapted to such high demand.
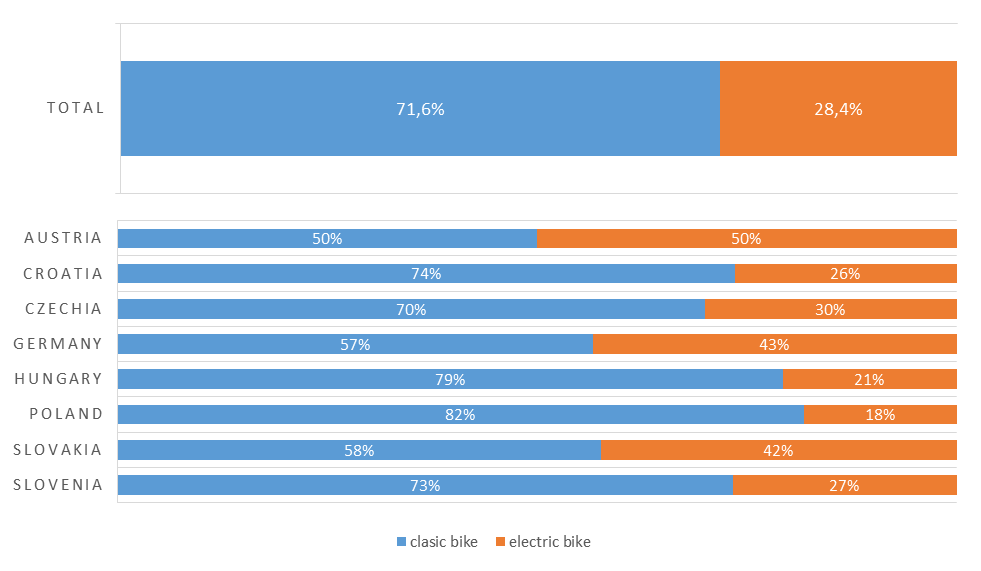
Or maybe an e-bike? Only in Austria has the share of e-bikes matched that of conventional bikes. Germany and Slovakia also achieved high results. In Poland, only 18% of trips are made by e-bike. This figure will rise in the coming years, so restaurants and lodging facilities can attract tourists by offering free battery charging.
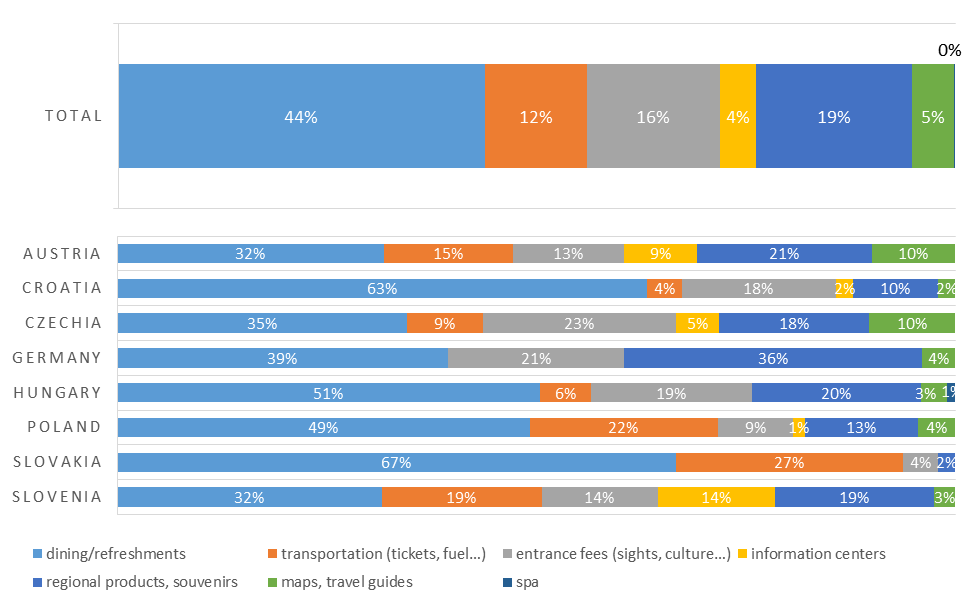
And what do tourists buy? Mainly food and public transportation tickets. 13% of people purchased various souvenirs and regional products, while 9% bought admission tickets to attractions or cultural venues. There are also those who bought paper guidebooks.
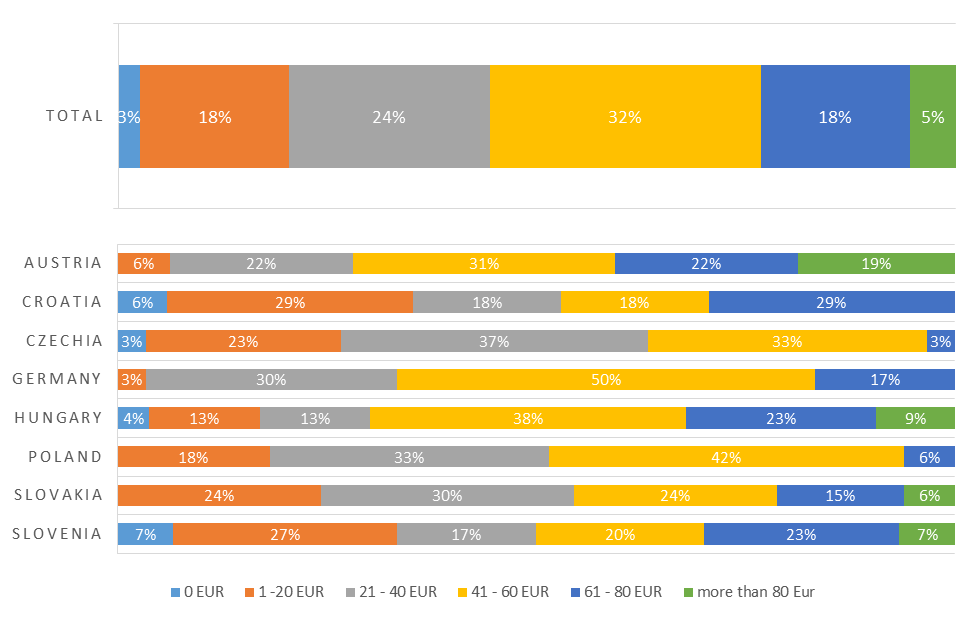
And how much does a cyclist spend? On the Velo Baltica route, everyone spent at least one zloty. 18% of people spent less than 85 zł per day, 33% between 85 and 170 zł, while as many as 42% spent between 170 and 255 zł per day. A few individuals spent over 255 zł per day. Croatia and Slovenia turned out to be the cheapest in this regard, while Germany and Austria are the most expensive countries.
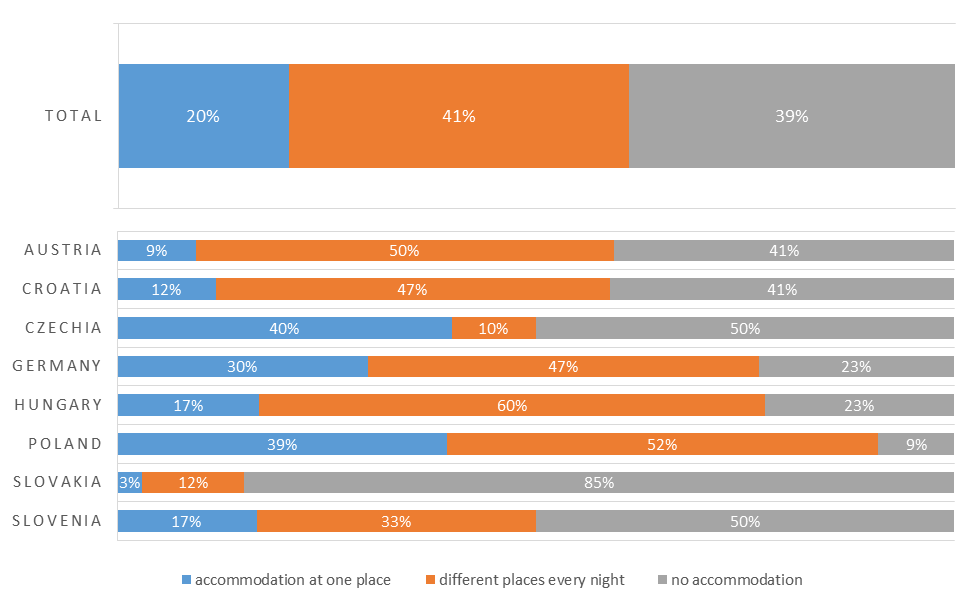
Loops or routes? If a cyclist decides to stay overnight, most people prefer to spend each night in a different place. Only 20% of travelers on the entire European route and 39% in Poland alone stayed in the same place the whole time. That is why the rules of our MPRs include a requirement to offer one night’s accommodation—this is very important for cyclists starting and ending their route in different places.
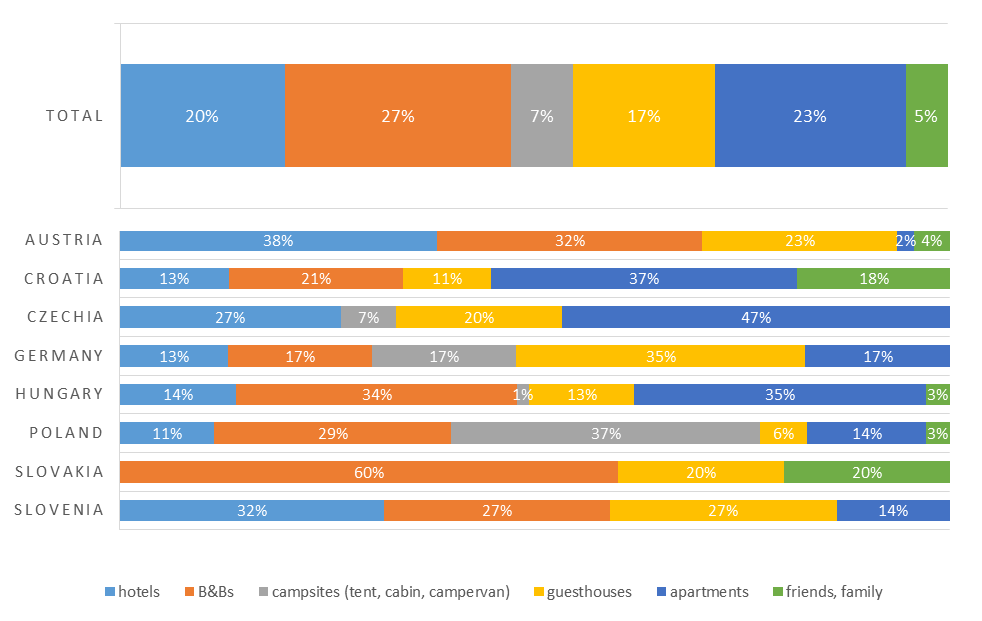
All right, so the cyclist already knows they’ll be sleeping in a different place every day and is aware of the daily distance. But where exactly will they choose to stay? When we look at the data from all countries, we see that hotels, guest rooms (understood as households offering a few rooms without a formal reception), bed-and-breakfasts, and private apartments are distributed roughly equally. Staying with family and camping also account for a small share. The situation is completely different in Poland. We are one of the few countries, alongside Germany, where camping is popular (37%). A large percentage also chose the Bed & Breakfast option, i.e., cozy guest rooms with lodging and possibly breakfast. In contrast, hotels (11%) and guesthouses (6%) are not particularly popular among cyclists on the Polish coast.
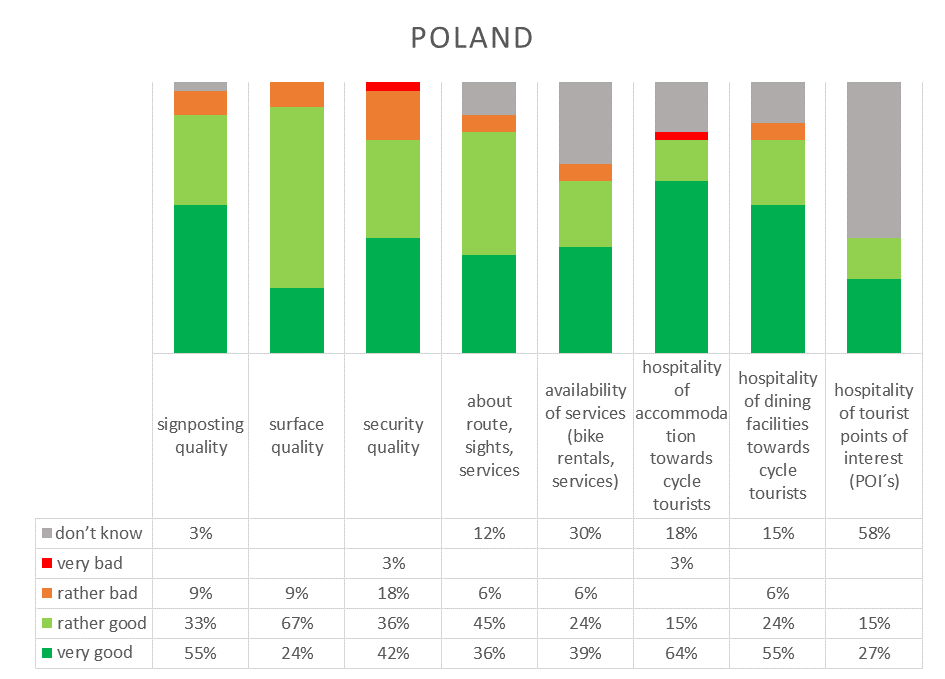
How do cyclists rate the EuroVelo 13 route? Let’s compare responses from all countries with the results from Poland. Overall signage is rated positively by 86% of respondents and negatively by 13%. This is a slightly worse result than along the Polish coast, where signs are legible for 88% of users, while 9% say they need improvement. It is worth noting that on a four-point scale, no one rated Velo Baltica’s signage as very poor, which makes us very happy.
The quality of the surface is good according to 77% of respondents, while in Poland it is as high as 91%. We realize that not all sections are perfect, but improvements are being made systematically—for example, the construction of a footbridge over Lake Kopań or the renovation of the access road to Gąski.
Is it safe? According to 81% of people in Europe and 78% of people in Poland—yes. As for the West Pomeranian section of the EV13 route, the biggest safety issues stem from conflicts between cyclists and pedestrians. The route often runs along pedestrian-bike paths or near the sea, where many tourists gather during the summer season. In such places, compromises are necessary—the route can run closer to the sea among tourists or farther from coastal towns, but at the expense of its original character.
Is it easy to find information about the route and services? Poland ranks at the EU average here—81% of respondents had no problem with this. 6% encountered moderate difficulties, and 12% were unsure because they did not actively seek this information.
The availability of services such as bike repair or rentals was rated positively by 56% of people, negatively by 13%, while 31% did not use them. These figures are very similar to the results from Poland. Here, too, about one-third of people did not need such services, and if anyone did use them, they practically always found a suitable option.
When it comes to the hospitality of lodging, dining, and tourist facilities, nearly all users of these services unanimously expressed satisfaction.
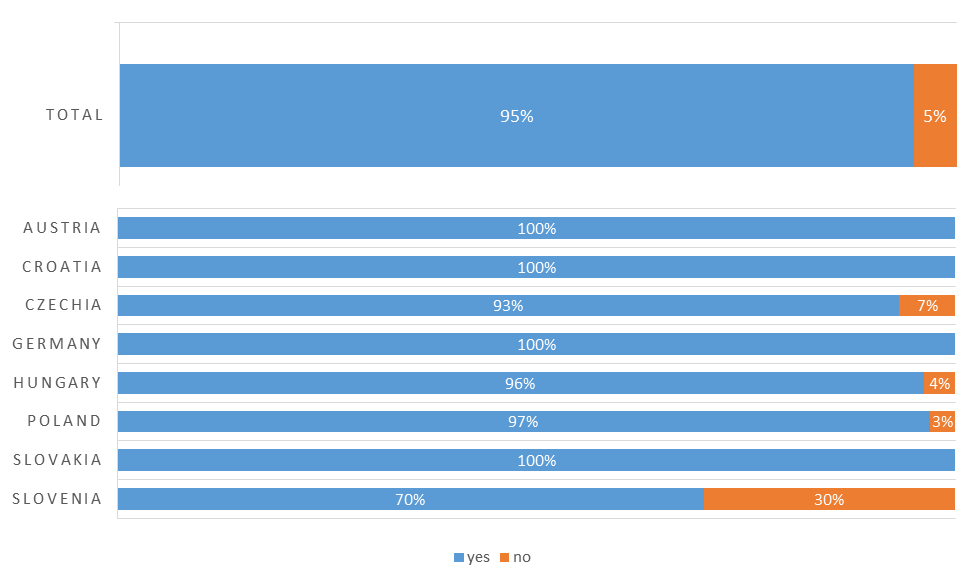
Is it worth returning to the Iron Curtain Trail? In all countries, our respondents stated that they would like to travel a section of the trail again. Only in Slovenia do 30% not plan to return, which may be due to the fact that it is a small country and its section of the trail is relatively short.
Summary
- Very high satisfaction —95% of cyclists plan to return to the route.
- Main users – people aged 30–59; men predominate (69%).
- Independent trip planning – 91% organize their trips on their own.
- Significant role of multi-day tourism – half of respondents take trips lasting several days.
- Motivations based on nature and activity – nature and sports are the key reasons for choosing a route.
- Travel mainly in pairs and small groups —most often two people.
- Digital navigation dominates – 60% of cyclists use an app on the route; Komoot is the most popular.
- Most common mode of transport to the route: car, though rail has untapped potential.
- The popularity of e-bikes is growing – nearly 30% of users ride them.
- Spending is at an average level, with the most money going toward food and drink.
- Diverse forms of accommodation —B&Bs, hotels, and campgrounds are popular.
- Frequent changes in accommodation —more than half of cyclists move to a new place every day.
- Very positive ratings for hospitality, but the road surface in some countries needs improvement.
- Uneven availability of cycling services (repair shops, rentals).
- Good ratings for signage, though they vary by country.
- A balanced mix of respondents from 8 countries, resulting in a reliable average.